Module 4: Genomic Selection
Optional — Predicting breeding values from markers
This module is optional/self-study. If we have time in the workshop, we’ll cover the basics. Otherwise, work through this on your own!
What is Genomic Selection?
Genomic selection (GS) uses DNA markers to predict an individual’s breeding value — how good their genetics are for a trait of interest.
The Traditional Problem
To know if a plant is a good parent, you traditionally need to:
- Cross it with other plants
- Grow the offspring
- Measure the trait in offspring
- Calculate breeding value from offspring performance
This is called progeny testing and it takes years.
The Genomic Solution
With genomic selection:
- Genotype individuals with markers
- Train a prediction model on individuals with both genotypes and phenotypes
- Use the model to predict breeding values for individuals with only genotypes
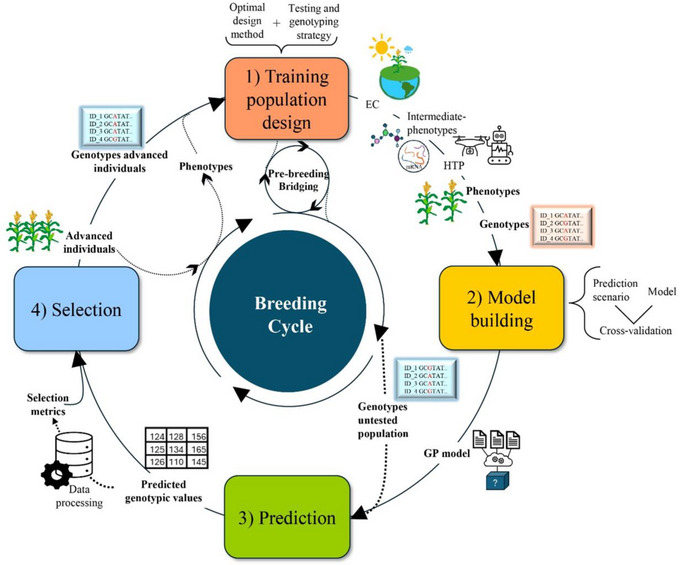
Figure: Escamilla et al. (2025), CC BY-NC-ND
We can predict performance before measuring the trait — even in seedlings!
How Does It Work?
The Basic Idea
The model learns which marker alleles are associated with higher trait values.
Marker effect estimates:
  SNP_001: +0.5 (good allele increases yield)
  SNP_002: -0.2 (bad allele decreases yield)
  SNP_003: +0.1
  ...
To predict a new individual, we sum up the effects of all their alleles:
Individual X has:
  SNP_001: 2 copies of good allele → 2 × 0.5 = +1.0
  SNP_002: 1 copy of bad allele  → 1 × -0.2 = -0.2
  SNP_003: 0 copies             → 0 × 0.1 =  0.0
  ...
  ────────────────────────────────────────────
  Predicted breeding value = sum of all effects
What You Need
| Component | Description | Required? |
|---|---|---|
| Genotypes | SNP data for all individuals | Yes |
| Phenotypes | Trait measurements | For training set |
| Training set | Individuals with both | Yes |
| Prediction set | Individuals to predict | Yes |
Prediction Accuracy
What is Accuracy?
Prediction accuracy is the correlation between predicted and true breeding values.
| Accuracy | Interpretation |
|---|---|
| 0.8+ | Excellent — GS very effective |
| 0.6-0.8 | Good — GS useful for selection |
| 0.4-0.6 | Moderate — Some benefit |
| <0.4 | Low — May not be worth it |
What Affects Accuracy?
| Factor | Effect on accuracy |
|---|---|
| Training set size | Larger → Higher |
| Heritability | Higher → Higher |
| Marker density | More markers → Higher (up to a point) |
| Relatedness | More related training/prediction → Higher |
| Trait architecture | Few large QTL → Higher |
You usually need at least 200-500 individuals in your training set for reasonable accuracy. More is better!
Running Genomic Selection in BIGapp
BIGapp provides two distinct features for genomic selection, each serving a different purpose:
- Predictive Ability — Estimate how well you can predict your trait (using cross-validation)
- Genomic Prediction — Generate actual EBVs and predicted phenotypes
What You Need
- Filtered genotype data (from Module 1) — VCF file with SNPs
- Phenotype data — A file with sample IDs and trait values
Phenotype file format:
Sample_ID,Yield,Height,Flowering
Plant_001,125.3,85.2,42
Plant_002,118.7,92.1,45
Plant_003,132.1,78.5,38
...- Use Predictive Ability first to assess if genomic selection will work for your trait
- Use Genomic Prediction to generate actual breeding values for selection decisions
Feature 1: Predictive Ability
This feature estimates how accurately you can predict your trait using genomic data. It uses k-fold cross-validation to test prediction accuracy.
How It Works
The analysis:
- Splits your data into k folds (typically 5)
- Trains on k-1 folds, predicts the remaining fold
- Repeats for all folds
- Calculates Pearson correlation between predicted and observed values
- Repeats the entire process for multiple iterations
This gives you a robust estimate of prediction accuracy before you invest in using genomic selection.
Demo: Running Predictive Ability
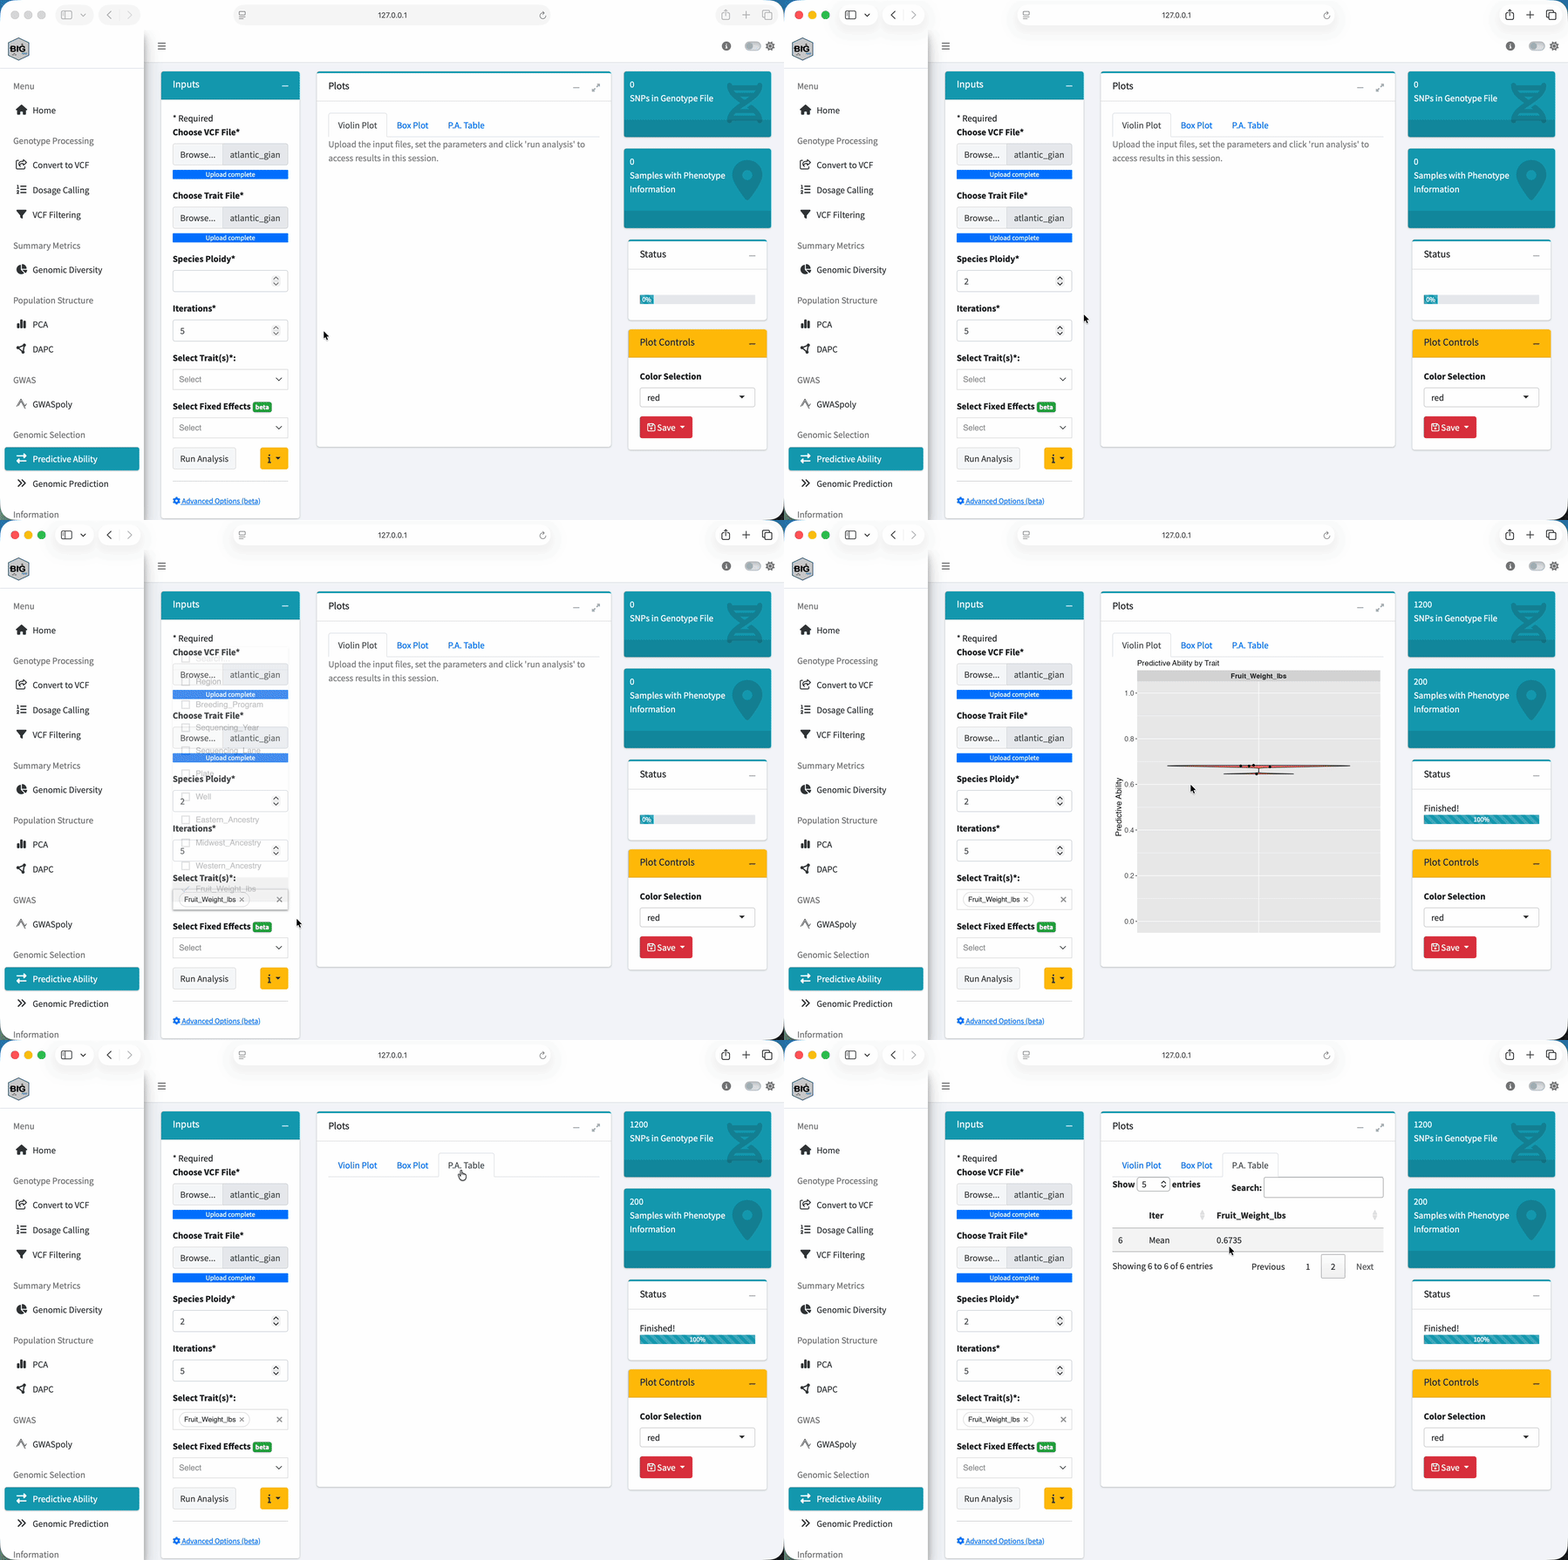
Detailed step-by-step guide available here
Steps:
- Navigate to “Predictive Ability” in the left menu
- Upload your VCF file (
atlantic_giant_pumpkin_diversity.vcf.gz) - Upload your trait file (
atlantic_giant_pumpkin_diversity_phenotypes.csv) - Select your species ploidy level
- Configure number of iterations (more iterations = more robust estimate)
- Select one or more traits to analyze
- (Optional) Configure fixed effects in Advanced Settings
- (Optional) Choose analysis method and relationship matrix type:
- G-matrix: Uses only genomic relationships
- H-matrix: Combines genomic and pedigree data (requires pedigree file)
- Click Run Analysis
Understanding the Output
The results include:
- Violin Plot — Distribution of prediction accuracies across iterations
- Box Plot — Summary statistics of accuracy
- P.A. Table — Detailed accuracy values for each iteration
- Summary statistics — Number of SNPs, number of samples with phenotypes
The accuracy values range from 0 to 1. Higher values indicate better prediction: - 0.8+: Excellent — Genomic selection will be very effective - 0.6-0.8: Good — Genomic selection is worthwhile - 0.4-0.6: Moderate — Some benefit, but may need larger training set - <0.4: Low — Consider improving training set or using different markers
Feature 2: Genomic Prediction
This feature generates actual predictions — both Estimated Breeding Values (EBVs) and predicted phenotypes — for your individuals.
Two Ways to Use It
Option 1: Single VCF File
Submit one VCF file containing all individuals. The tool will:
- Train a model on individuals with phenotype data
- Generate predictions for all individuals (including those without phenotypes)
- Indicate in output tables which samples had trait data
Option 2: Separate Training and Prediction Sets (Advanced)
Use Advanced Options to upload two VCF files:
- Training VCF: Individuals with phenotype data
- Prediction VCF: New individuals to predict (no phenotypes needed)
This is useful when you have a separate validation population or new breeding lines.
Steps to Run
Detailed step-by-step guide available here
- Navigate to “Genomic Prediction” in the left menu
- Upload your VCF file
- Upload your trait file
- Select your species ploidy level
- Choose one or more traits to predict
- (Optional) Configure fixed effects
- (Optional) For two-file approach: Upload second prediction VCF in Advanced Options
- Click Run Analysis, then Proceed
- Wait ~2 minutes for results
Understanding the Output
The results include two key tables:
1. Predicted Phenotype Table
- Predicted trait values for each individual
- Indicates which samples had original trait data
- Shows model’s predicted values vs. observed (where available)
2. EBV Table
- Estimated Breeding Values for each individual
- Relative genetic merit for the trait
- Use for ranking and selecting parents
Both tables are downloadable for use in breeding decisions.
- Rank individuals by EBV to identify top performers
- Select parents with highest EBVs for crosses
- Make early selection on seedlings before phenotyping
- Prioritize resources by phenotyping only high-EBV individuals
Understanding Cross-Validation
The Predictive Ability feature uses cross-validation to estimate how well your model can predict trait values.
How Cross-Validation Works
Since we don’t know the “true” breeding values, we estimate accuracy using k-fold cross-validation:
- Split the training data into folds (e.g., 5 folds)
- Train on 4 folds, predict the 5th
- Repeat for all folds
- Calculate correlation between predicted and observed
- Repeat the entire process multiple times (iterations)
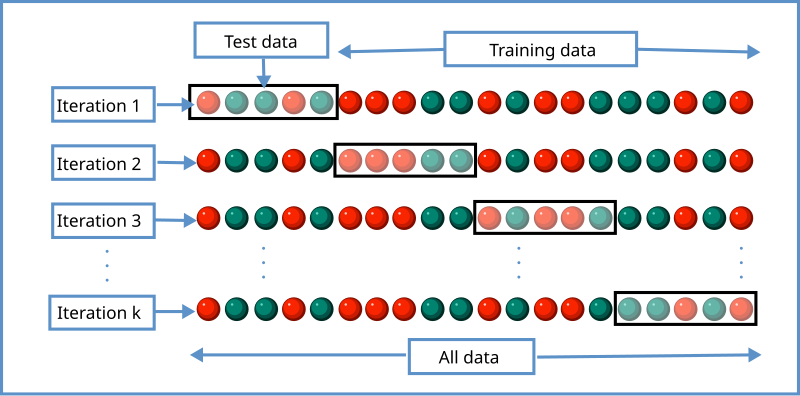
Figure: Wikimedia Commons, CC BY-SA 4.0

The Predictive Ability feature does this automatically and reports the distribution of accuracy across iterations.
Try It Yourself
- Load the pumpkin data with phenotypes
- Go to the Predictive Ability tab
- Run the analysis for Fruit_Weight_lbs
- What accuracy do you get?
With the pumpkin dataset, you should see cross-validation accuracy around 0.5-0.7 for fruit weight. This is typical for a quantitative trait with moderate heritability.
Interpreting Results from Genomic Prediction
Predicted Breeding Values (GEBVs)
The Genomic Prediction feature output includes a Genomic Estimated Breeding Value (GEBV) for each individual.
Sample_ID    GEBV      Rank
Plant_047    +2.34     1
Plant_012    +2.18     2
Plant_089    +1.95     3
...
Plant_023    -1.87     198
Plant_056    -2.15     199
Plant_071    -2.43     200
Higher GEBV = better genetics for that trait.
How to Use GEBVs
| Use case | How to apply |
|---|---|
| Selection | Select top-ranked individuals as parents |
| Culling | Remove low-ranked individuals early |
| Crossing | Plan crosses to maximize GEBV of offspring |
| Ranking | Prioritize individuals for phenotyping |
Even moderate accuracy (0.5-0.6) can dramatically improve selection efficiency because you can evaluate many more individuals than with traditional phenotyping.
Practical Considerations
Training Population Design
Your training set should:
- Represent the breeding population — Similar germplasm
- Cover the range of trait values — Not just extremes
- Be large enough — 200+ individuals minimum
- Have accurate phenotypes — GS can’t fix bad data
When GS Works Best
✅ Traits that are expensive/slow to phenotype
✅ Traits with moderate-high heritability
✅ Breeding programs with existing genotyping
✅ When you can select among many candidates
When GS May Not Help
❌ Very low heritability traits
❌ Small breeding programs (<100 selection candidates)
❌ Traits easy/cheap to phenotype directly
❌ No connection between training and selection populations
Exercise
Using the pumpkin data, practice using both BIGapp features:
Part 1: Assess Predictive Ability
- Navigate to the Predictive Ability tab
- Load your VCF and phenotype data
- Run the analysis for Fruit_Weight_lbs
- Note the cross-validation accuracy from the plots
- Review the violin plot and box plot distributions
Part 2: Generate Predictions
- Navigate to the Genomic Prediction tab
- Load the same VCF and phenotype data
- Run the analysis for Fruit_Weight_lbs
- Review the Predicted Phenotype Table and EBV Table
- Identify the top 10 individuals by EBV
- Look at which regions these top individuals come from
Predictive Ability: You should see accuracy around 0.5-0.7, indicating moderate-to-good prediction potential.
Genomic Prediction: The top-ranked individuals by EBV will likely be from the Eastern region, which has the highest average fruit weights in the dataset. This makes biological sense — Eastern breeding programs have historically focused on giant pumpkin competitions!
Discussion questions:
- Based on the predictive ability results, would you use GS for fruit weight in your program?
- What accuracy would you need to make GS worthwhile?
- How could you improve accuracy?
- How would you use the EBV rankings in practice?
Key Takeaways
✅ Genomic selection predicts breeding values from markers
✅ BIGapp has two features: Predictive Ability (assess accuracy) and Genomic Prediction (generate EBVs)
✅ Use Predictive Ability first to determine if GS will work for your trait
✅ Use Genomic Prediction to generate actual breeding values for selection
✅ Cross-validation estimates prediction accuracy before you invest in using GS
✅ Even moderate accuracy enables selection among many candidates
✅ Training population design matters!
You’ve Completed the Workshop!
You’ve learned the core genomic analysis workflow:
- Import & QC → Clean, filtered genotype data
- PCA → Understand population structure
- GWAS → Find markers associated with traits
- Genomic Selection → Predict breeding values
From here, you might explore:
- Your own data — Apply these methods to your breeding program
- Advanced models — Multi-trait prediction, GxE, etc.
- Marker-assisted selection — Combine GWAS hits with GS
Resources
- BIGapp GitHub — Report issues, request features
- BIGapp Tutorials — Step-by-step guides
- Genomic Selection Review — Meuwissen et al., the foundational paper
Questions?
- Email: aherranssanderco@ufl.edu
- GitHub: github.com/alex-sandercock
- BIGapp issues: github.com/Breeding-Insight/BIGapp/issues
Thank you for attending!